


In our previous post, we revealed that in the Pacific Engagement Visa’s (PEV) first two years 4,006 visas have been issued. How have they been distributed across countries? As intended, PNG has been the big winner with 44% of the visas issued, followed by Fiji and Timor-Leste with 13% each.
So, it is clear who the winners are in absolute terms. It is the larger countries. What about in relative terms — that is, relative to PEV quotas? The final quotas for the first two years, and the preliminary quota for the current year, are presented below.
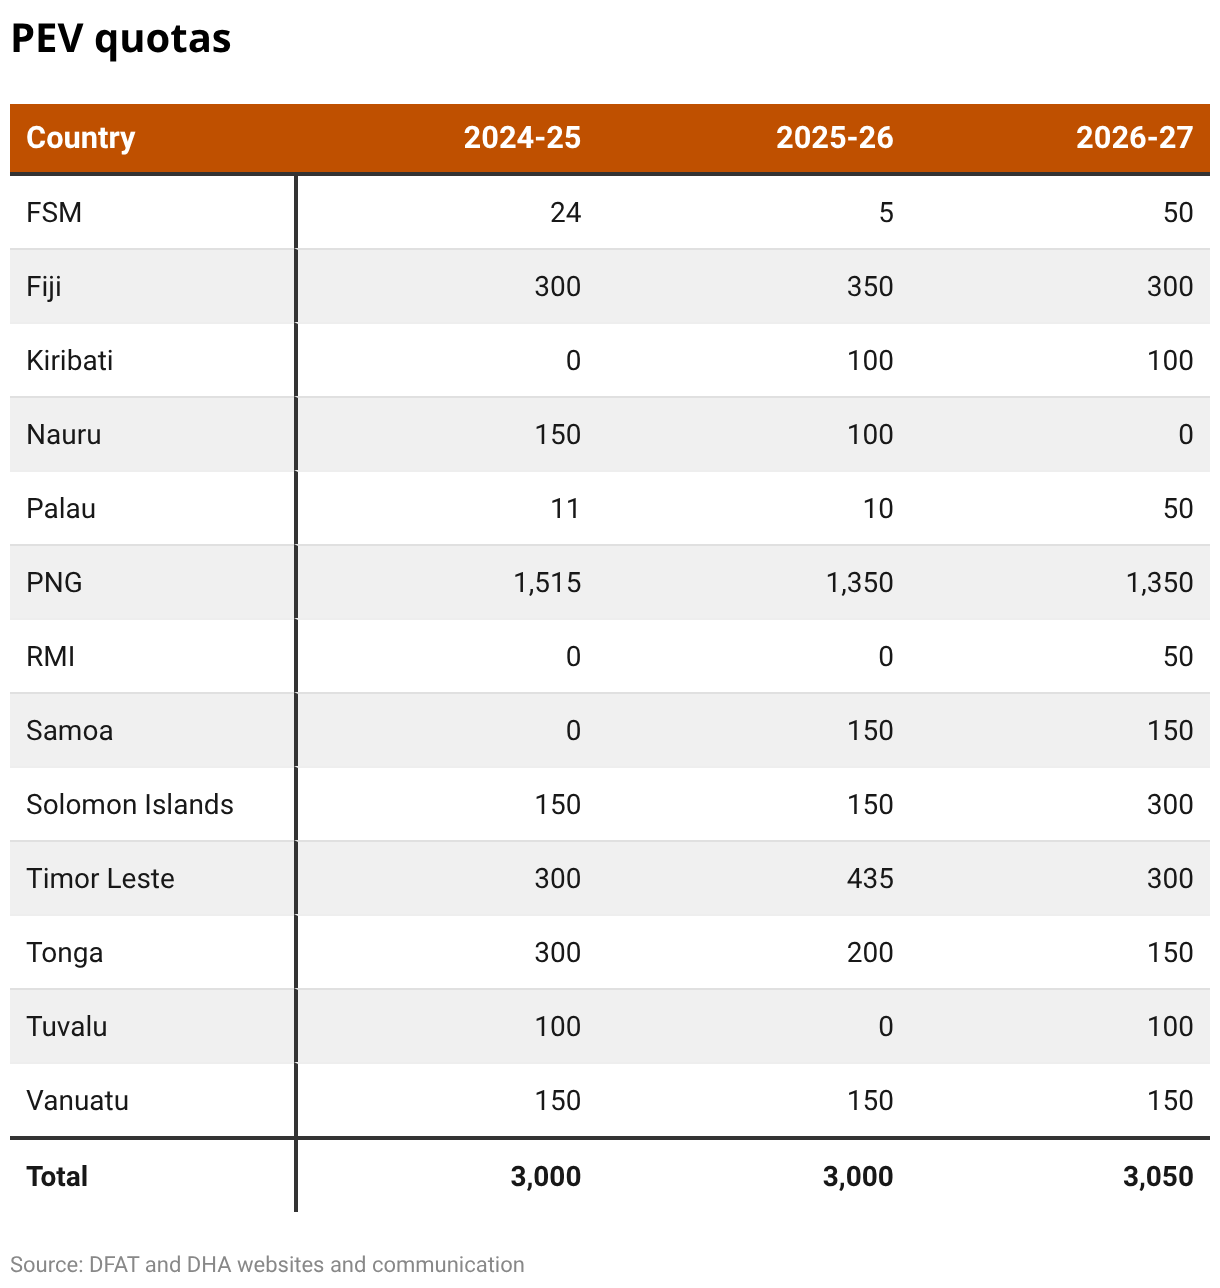
In both of the first two years, some visas were initially held back or reallocated. In 2024–25, the government held 300 slots in reserve in case Samoa and Kiribati joined late, which they didn’t (they did the next year). The extra visas — along with unused visas from FSM and Palau — were given to PNG (its quota increased from 1,350 to 1,515) and Tonga (150 to 300).
In 2025–26, 150 reserve visas plus 85 unused visas from FSM and Palau were distributed to Fiji (50), Timor-Leste (135) and Tonga (50). The 2025–26 increases, unlike the 2024–25 ones, were not announced in advance. No country got significantly more than its 2025–26 quota of visas in that year. This suggests that increases were used at the margin to lift individual country quotas to help hit the aggregate 3,000 ceiling in the year.
This year, the 3,000 ceiling will easily be hit, and probably as early as December. There will also be less scope for reallocation as the quota total is already 3,050. The compact states will underutilise their quotas; even so, that will only leave 100 slots at most to redistribute.
Having established the quotas, we can now examine relative performance by comparing grants and quotas across countries. After two years, Samoa is the most successful, with a success rate of 100%, which is remarkable since it only entered the PEV in 2025–26. Samoa is closely followed by Tuvalu which has a success rate of 96%. (Tuvalu sat out of the regular PEV in 2025–26.) At the other end of the spectrum, Tonga, PNG, Kiribati, Vanuatu and Nauru all have success rates in the 55%–62% range.
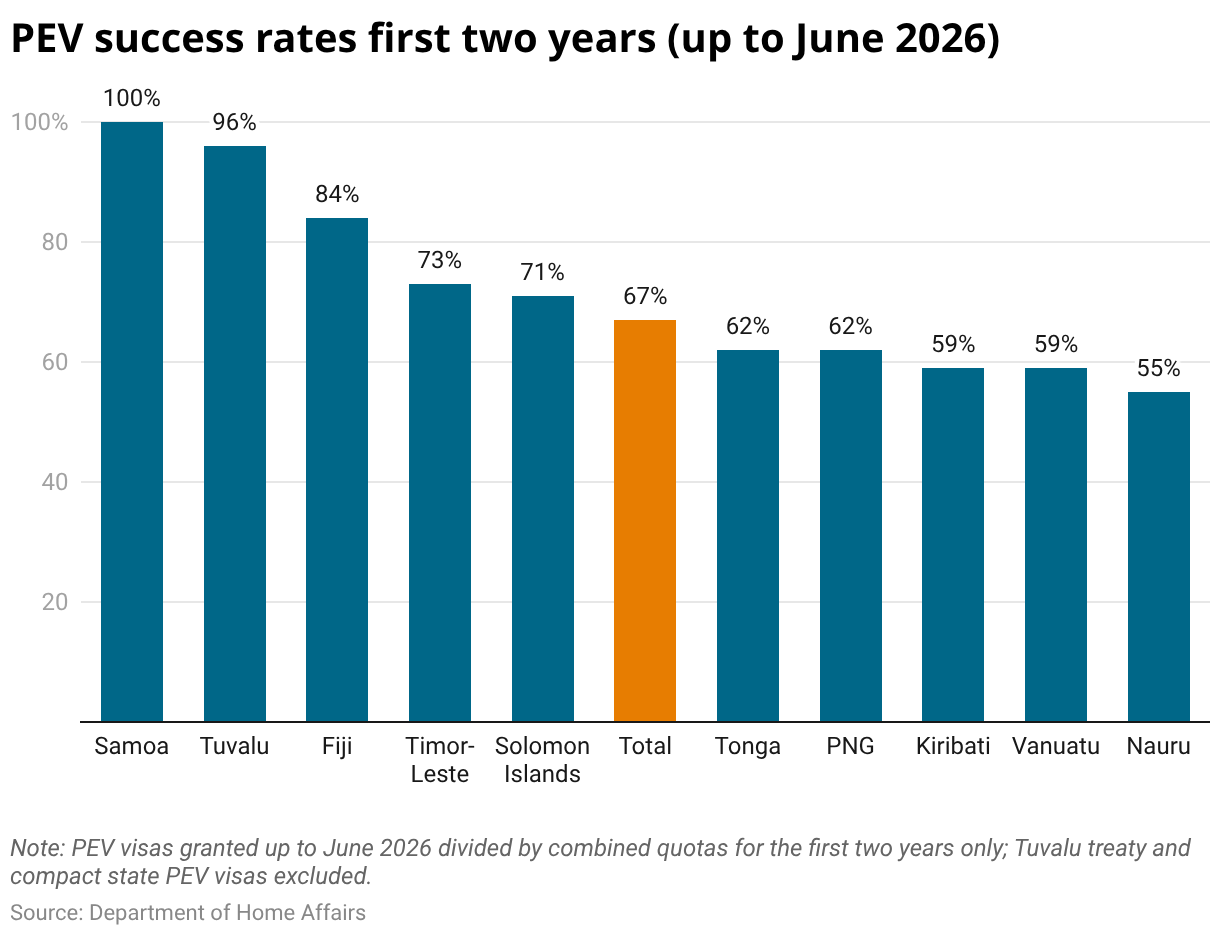
What lies behind these greatly different success rates requires further research. There is certainly a case for targeting further assistance to find a job and for giving more invitations to ballot registrants from the less successful countries.
Read part 1.
