
A Pacific worker putting in 30 hours on an Australian farm, earning $937 and taking home just over $100 after deductions, as put to a Senate committee in 2022, became, for many people, a defining image of the Pacific Australia Labour Mobility (PALM) scheme. The Australian Workers’ Union built a campaign around workers earning over $800 but keeping under $100. The Immigration Advice and Rights Centre warned of workers left with $100 to $200 a week. In 2024, José Ramos-Horta said at the National Press Club: “A dormitory for eight people with bunks, turns out to cost a week $700 — it’s more expensive than Tokyo, so exploitative”. The idea that PALM workers keep little after deductions has shaped changes to the scheme more than any other.
The Pacific Mobility Labour Survey (PLMS) Wave One measured what participants earned after tax and deductions, what was deducted, and hours worked. Three caveats apply throughout. First, data are self-reported by workers. Second, the data relate to the scheme before the June 2023 reforms, showing things as they were then, not now. Third, none of what follows makes the worst cases less real: Aleki’s $100 week happened and the employer did not dispute the figure, instead citing a $30,000 “average annual net benefit”. Yet, the scheme cannot be reduced to its worst week, and the key questions are how common such problems are and where they fall.
Figure 1 shows that the typical (median) PALM worker reported $800 take-home pay after tax and deductions in the reference week. While most keep a substantial wage, about 4.8% (short-term: 5.1%; long-term: 2.4%) took home less than $200 — the floor recent reforms guarantee. Crucially, earnings here are from a single recall week, which means that the worst take-home and deduction-share figures (below) include atypical weeks (arrivals, quarantines, holidays, illness) when pay dips but fixed costs like rent do not, mechanically depressing the take-home amount and inflating the deduction share. Overall, however, campaigners have not invented the low-paid workers; rather, they have focused on the left tail in the figure below, and led with it.
Figure 1: Weekly PALM worker pay after tax and deductions
Source: PLMS Wave One, author’s calculations (weighted).
Deductions tell a similar story. While the median deduction share of post-tax pay is 12% (the average is higher, around 25% in our report, as deductions are concentrated in workers’ first months while airfares are repaid), 18% and 6% of workers reported that more than 30% and 50%, respectively, of their post-tax pay was deducted in the reference week. Note that these shares count only non-tax deductions, measured against post-tax pay. On a gross earnings basis, treating tax as an additional deduction, as workers themselves often do, deductions are higher (see note). Deductions are mostly the costs of being there (accommodation, transport to work and a share of international airfares), where the relevant arrangements are made by employers, who recover the costs, and usually no more, via deductions. These are all costs workers would have to meet anyway, except that if they did so directly they would generally face higher transaction costs, quality risks and information barriers. These in-country costs represent consumption to support workers’ own living standards, not random imposts on their wages (and some airfare costs do return to the Pacific).
Deductions vary widely based on the cost of participation. Figure 2 shows that, for the median ni-Vanuatu worker, deductions account for 10% of pay, while this figure is 16% for Tongans and 22% for I-Kiribati workers. Distance is mostly to blame. As employers contribute $300 towards return airfares and recoup the rest, a placement from an atoll in Kiribati or Ha’apai is much more costly for participants than one from Port Vila.
Figure 2: PALM deductions as a share of post-tax pay, by origin country, 2022—23

Source: PLMS Wave One, author’s calculations (weighted).
Even these figures understate the true cost of participation. If I add out-of-pocket costs, the median deduction share lifts from 12% to 16%. And as Wave One asks only about the last month, recurring costs like rent and transport are captured well, but lumpy airfares, often paid upfront, spread unevenly, or incurred pre-departure, are not.
Thus, “pay left after deductions” is a bit of an awkward metric. Much of what is deducted buys important real things and most workers would rather not arrange these things themselves. The real concerns are that some employers may overcharge and that some workers do not fully understand what they are paying for, two issues targeted by recent changes to the scheme.
Looking briefly across the Tasman, New Zealand’s Employment Court recently ruled (in Soapi v Pick Hawke’s Bay Inc [2025] NZEmpC 208) that deductions for accommodation, travel, insurance, airfares and equipment, which sometimes left workers with as little as $100 a week, and in some weeks nothing at all, breached the Wages Protection Act 1983 and the Minimum Wage Act 1983. Recognised Seasonal Employer (RSE) scheme deductions must now only be for actual, reasonable and verifiable costs, consented to, and approved by Immigration New Zealand, with some reimbursed to workers. Rather than a fixed share of wages, accommodation charges are also now moving to a standardised, quality-based method set by the Ministry of Business, Innovation and Employment (MBIE).
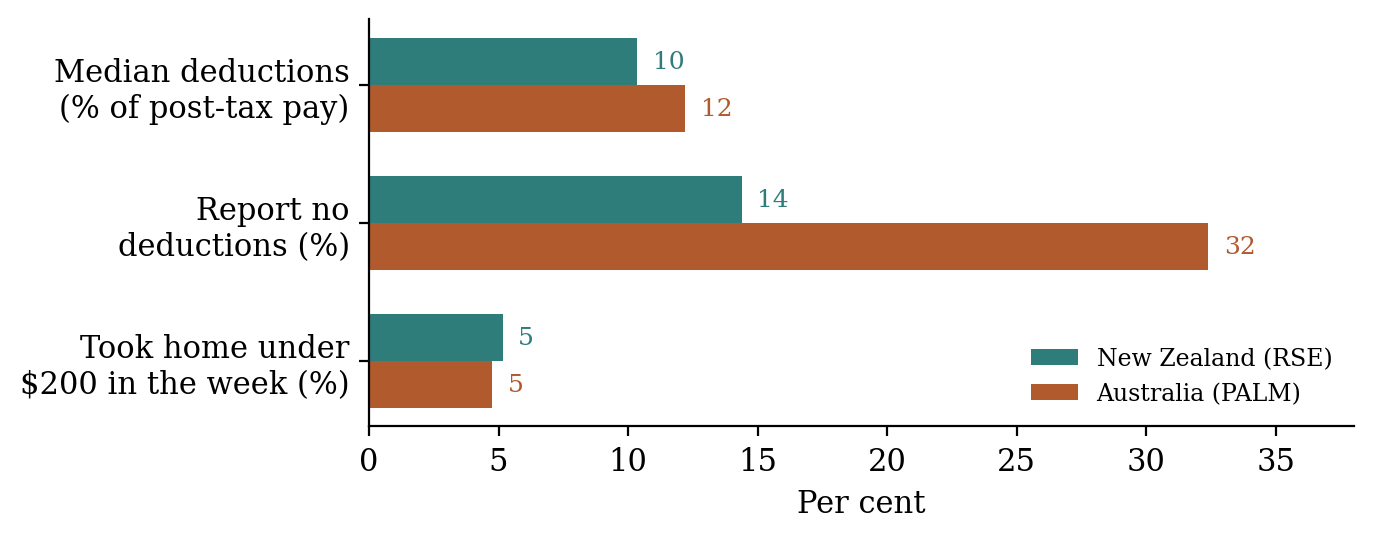
PLMS Wave One covered RSE workers and allows us to, as we have done above with the 2023 PALM reforms, set that case against the data it responded to. The two schemes differ in settings, legislative frameworks and labour markets, so this is a broad comparison rather than a strictly like-for-like one. Figure 3 shows that realised deductions in New Zealand look much like those in Australia (a median 10% share and about 5% taking home under $200 in the reference week), except more universal (that is, fewer workers report no deductions). The squeezed minorities thus appear to be very much real on both sides of the Tasman, and policy responses are now also broadly similar, including likely impacts on employers and demand.
Figure 3: Worker realisations in New Zealand (RSE) and Australia (PALM), 2022—23
Source: PLMS Wave One, author’s calculations (weighted).
Work hours — which, besides occupation, are the main determinant of earnings — are something I have written about before but will say more about here, as this is important for thinking about that left tail. If we look at PALM workers who reported at least one week under 15 hours during their stay (which can be up to four years for long-term workers), some cases reflect one-off pandemic quarantines (especially for long-term workers with placements spanning border closures) but most reflect ordinary ebbs and flows (holidays, weather, sickness and part-weeks on arrival and departure). The genuinely demand-driven part — that is, weeks where the employer simply did not have enough work to give — appears to be around 6%, smaller for long-term workers on full-time contracts.
Figure 4: Why PALM workers experienced low hours, by stream, 2022—23

Source: PLMS Wave One, author’s calculations (weighted).
Where does this leave us? The problematic headline cases exist, but they are the exception rather than the rule. Most PALM workers keep a substantial wage after taxes and deductions, and reforms appear quite well targeted at the minority who might not. “Left with nothing” is the right description of a troubling minority but the wrong description of the scheme as a whole. Both, of course, can be true at once.
Like my last post, this post provides an example of what you can do with PLMS data. Wave One describes the scheme just before it was tightened. The question of whether the reforms actually worked is one that Wave Two, now in the field with updated data coming later this year, is carefully designed to answer.
Note: PLMS Wave One records only post-tax earnings, not tax or super, so I cannot reproduce a gross-earnings, tax-included measure sometimes used in New Zealand. Richard Bedford’s data puts this measure at about 29% of gross and suggests that self-reported data tend to understate recurring deductions, so the shares here are best thought of as a conservative lower bound.